Call Now: 1-800-983 2826

Project management methodologies: which one is best for linear projects?

A comparison of traditional project management methodologies vs the linear scheduling method.

Whether the project management tool you choose is Microsoft Excel, CAD or more robust and specialized tools like Primavera or Microsoft Project, the end result is that your linear project plan remains a GANTT chart with no connection to where you are working on the ROW.

Using Time Distance charts versus Gantt Charts on linear projects is often the difference between being able to easily  identify trends and issues in certain sections or a project plan  that lacks clarity and visibility to the Project Team.

GANTT charts are:

project management methodologiesSimplistic

They do not show what progress has happened where along the ROW.

project management methodologies

Inaccurate

They estimate a constant rate of productivity in fluctuating conditions.

project management methodologies

Confusing

They produce a large amount of paperwork, yet fail to clearly convey the scope.

project management methodologies

Difficult to change

They do not incorporate equipment move arounds or other realities of linear projects.

Here we review the most popular project management tools for their suitability to plan linear projects such as roads, railways, bridges and pipelines.

The most basic of project management tools and techniques, Microsoft Excel or CAD, when used for linear projects, typically display the project in a bar chart, GANTT chart or network diagram.

Microsoft Excel & CAD Tools vs. the Linear Scheduling Methodology:

Project management charts like GANTT charts, bar charts or network diagrams can be hand-drawn, or quickly and easily created using tools like CAD or Microsoft Excel.

Easy to create – impossible to keep current

While appealing due to the lack of substantial up-front investment, and the fact that even junior staff members can create these project management charts, the hidden cost of using these traditional project management tools become apparent as soon as there is a change to the linear project plan.

As soon as there is a change to the linear plan due to weather or other constraints, pages and pages of GANTT charts must be amended and recreated.

(and usually the new charts are ready just in time for another change to the plan.)

Progress against the baseline is difficult to determine

When it comes to reporting specifics on progress or delays, GANTT charts simply don’t have the ability to show exactly what work has been done, where along the ROW.

(Often, documenting progress against the linear project baseline is left to the field construction manager to perform manually.)

Complicated and confusing project planning meetings

Using GANTT, network diagrams and bar charts makes it almost impossible to communicate the progress of a linear project to team members and contractors. Field personnel need to know where they have worked and where they will work next. This is not possible with a Gantt based CPM tool.

Communication is key in project planning meetings to manage construction challenges along a ROW.  Communicating and presenting to key stakeholders become especially challenging when a concise summary of the progress of the project is expected, along with detailed information on delays or events that may compromise the project’s schedule and budget. A time-distance plan effectively communicates  where work has occurred, where work rates have been impacted by field conditions and are easily understood by key stakeholders.

Conclusion:

As a project management method for complex linear infrastructure projects, using CAD or Microsoft Excel to produce GANTT charts, Bar Charts or Network diagrams is highly ineffective and a drain on resources while failing to produce complete or up-to date information that can be understood by all parties involved.

The CPM Schedule vs Linear Scheduling Method

Project Management Systems such as Primavera or MS Project are often used to create a Critical Path Method or CPM schedule for a linear project.  

The planner creates a series of discrete activities and then logically connects these activities. Resources can be added to each schedule activity and resource loading can be easily displayed. In order to maintain crew sequencing in a linear-type project, the planner ensures that each activity is connected to its successor by a Start-Start and a Finish-Finish relationship.

These project management tools also produce a GANTT chart. This GANTT chart will then display a graphical representation of the project sequence, and the plan will progress from this baseline.

CPM Schedules may produce an inaccurate baseline

Project management tools such as Primavera or MS. Project automatically plan the project based on the CPM schedule and can be updated more easily than manually updating a GANTT Chart or CAD Drawing. However, they still present issues that threaten the timely completion of a complex linear infrastructure project.

Most estimates and CPM schedules assume a consistent productivity (or work) rate for each crew along the ROW. This productivity factor is then applied for the entire length of the ROW to determine the duration of each crew.

However applying a consistent productivity rate to a crew doesn’t account for changes in profile, terrain, amount of mass haulage required based on ROW elevation, weather changes and many other factors that impact the productivity rate of a crew.

Because of the high likelihood of an inaccurate productivity rate CPM schedules, they simply do not completely or accurately convey the baseline project schedule.

ROW challenges using CPM Schedules are difficult to represent

In cases where the right of way (ROW) access may be interrupted during particular times due to weather, crossings, permitting or other factors external to simple resource allocation, the CPM Schedule as a project management methodology lacks a simple way to easily modify the plan.

Equipment move-arounds then become difficult and clashes become harder to prevent, and almost impossible to proactively manage before construction starts.

Where are we with this project?

For project planning managers, the ability to accurately answer this question and plan for the next section is critical.

And while the typical CPM schedule progress report may show that a crew is 45% complete, it assumes the progress is from start to finish and does not connect completion with the physical ROW. A CPM Schedule does not show exactly where the work has been done and where it is yet to be done.

This approach often causes problems for construction managers.

Linear projects by nature, don’t often progress in a sequential fashion. Equipment move-arounds are standard procedure and it’s necessary to ensure crews are adequately spaced apart.

Planning meetings are still confusing:

While the CPM Schedule sounds like a good project management method for scheduling linear projects, in reality the CPM Schedule only tells half the story of a linear project.

Developed in 1957 specifically for projects that are broken down into a complex series of chronologically discrete activities that are logically connected in a sequence from project start to finish, the Critical Path Method is better suited for the construction of buildings and other facilities (power generating stations, refineries, etc.) and are not adequate for the constructability issues and demands of building linear project  such as a pipeline, rail system or roadway.

Conclusion:

As a project management method for complex linear infrastructure projects, using the Critical Path Method to produce GANTT charts is highly ineffective and a drain on resources while failing to produce complete or up-to date information that can be understood by all parties involved.

Line Of Balance Method

The Line of Balance Project Management Method (also known as the Vertical Production Method) is another common project management methodology used to plan repetitive work such as constructing multiple dwelling units.

project management methodologies

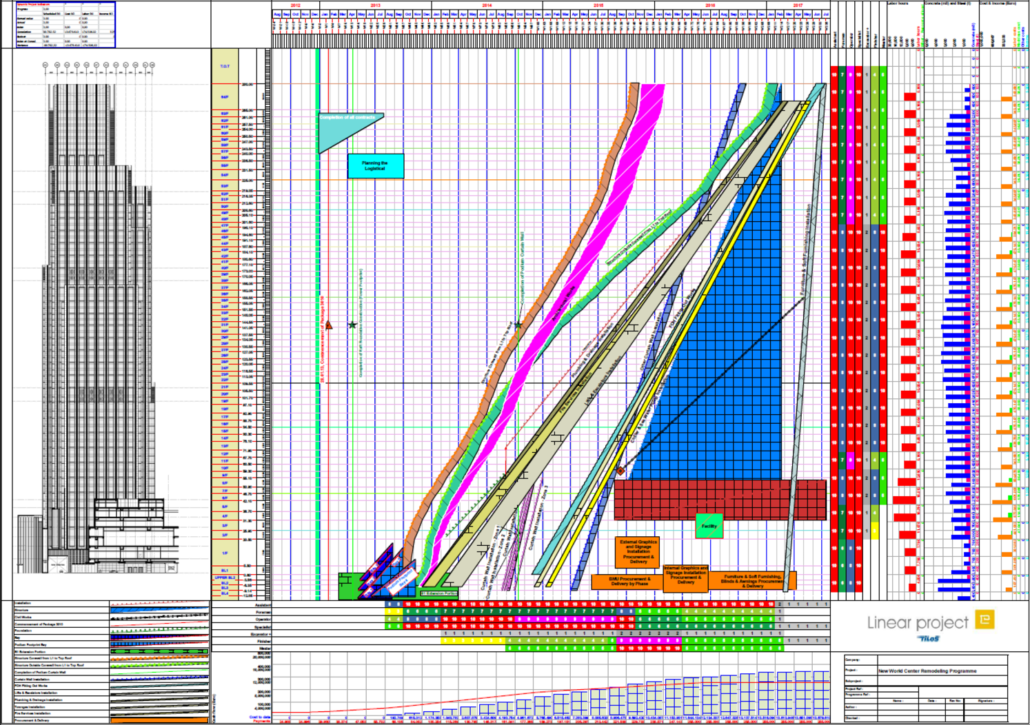
Here is an example of using TILOS for a large office building in Hong Kong

When used for linear infrastructure projects like roads, railways and pipelines, this project management technique is more accurately called the linear scheduling method.

The linear scheduling method is also referred to by it’s output, a Time Location or Time Distance chart.

The Linear Scheduling Method: A Project Management System For Linear Projects

The key component of the linear scheduling method is the creation of the project management chart known as a march chart or Time Distance chart to display the project in two dimensions: time and distance.

Instead of trying to convey a time-distance project in one dimension, March charts are specifically designed for projects where time and distance are the two main components that need to be accounted for.

The number of resources required to build and manage a Time Distance is a small fraction of the number needed to develop a CPM Schedule to the same level of detail.

The benefits of the linear scheduling method for your project:

Complete and accurate baseline versus execution information.

March charts enable project planners to integrate the schedule with the physical site data and logistical constraints.

Instead of creating and presenting the plan as a series of Gantt bars, this approach allows the planner to integrate and print as much detail as required about the schedule on a single page. This detail can include elevation profiles, land acquisition, spend curves, geotech data, environmental windows, crossings and crew movement and direction of travel along the ROW.

project management methodologies

Anticipate Issues and Optimize The Plan

In its most basic form, march charts show each crew represented by a different shape or line type, color or shape. Usually distance along the ROW is horizontal and increases from the left to the right. Time is typically represented vertically, increasing from bottom to top. The advantage of a march chart for linear projects is immediately obvious as you can determine the location of each crew at any particular point in time.

Any issues associated with crew productivity rates are also readily apparent.

A march chart can be further enhanced by adding additional layers to the plan. You can display any other critical element of your project, such as Right of Way Restrictions, Weather Issues and more.

.

project management methodologies

Accelerate The Schedule

From the unique perspective of viewing the entire scope in one view, not only are potential risks obvious, but opportunities to accelerate the schedule become readily apparent.

Equipment sequencing and crew productivity rates can then be modified to reduce inefficiencies and speed up the project as a whole.

project management methdologies

Easy to understand, communicate and present the plan.

Global leaders know that using a Time Location Diagram or March Chart is by far the best way to plan, optimize, modify and execute a complex linear infrastructure project because it displays the entirety of the project scope in just one view.

project management methodologies

Automate Time Distance Charts with TILOS software

March charts can also be hand-drawn or developed in CAD, however manually created Time Distance diagrams will still be easily outdated. Many planners prefer to use automated linear scheduling software tools like TILOS.

TILOS helps linear project planners to:

  • Identify equipment and activity clashes in the schedule.
  • Optimize the schedule to ensure continual use of resources and reduce time in field.
  • Plan mass haulage (one of the biggest cost drivers for linear projects)
  • Present and communicate the project’s complexities to various parties including stakeholders, contractors, junior engineers and owner companies.

Watch the Presentation:

Use of Linear Scheduling with Civil Infrastructure Projects to Enhance Project Value & Reduce Risk

Linear scheduling methodology (LSM) involves the use of distance/location data in addition to the time information in planning repetitive construction sequencing for infrastructure projects. This methodology, derived from the Line of Balance (LOB) planning methodology developed by the US Navy in the 1950’s, is widely used globally. To date, distance-based planning has been effectively used for road, rail, tunnel, bridge, dam rehabilitation, pipeline, and power distribution projects in North America. 

The application of LSM in infrastructure projects allows for the optimization of the execution plan and subsequent reduction of scheduled time in-field with the resultant decrease in costs. LSM is also used for claims analysis to understand and clearly present project delays, as well as risk analysis to assess mitigation opportunities. 

This presentation will provide an overview of the methodology and review the application of linear planning in infrastructure projects to effectively identify risk, optimize time in-field, and reduce overall cost. 

Some of the brands that trust TILOS

“TILOS is making our lives easier. It helps us to sort out any issues of logic before they become a problem. It also allows us to communicate clearly to all teams involved exactly what we are aiming to do and is a good tool to demonstrate to all stakeholders what we are going to deliver.”

Awesome piece of software, with many applications on the job.

Our company is one of North America’s largest pipeline owner companies. Having researched the marketplace for a linear project planning tool, we chose TILOS.  When we have used TILOS on major pipeline projects during construction, it has provided rich construction decision support information.

This information is used to: optimize the construction program with resultant direct dollar savings.

For me, TILOS is the ultimate tool to overlook and plan all schedules along a distance. Much better than a bar chart.

I have found TILOS to be simple and it is now central to my preparation of tender or cost estimates. Importantly, it allows me to immediately update data when changes occur and provide real-time monitoring of progress.

TILOS transformed our engineer’s attitude to project scheduling from something extra they never had time for to a tool they “owned” and wouldn’t go to a meeting without.

I have seen similar software programs earlier, but TILOS is the most flexible and informative I’ve seen up to now.

You May Also Be Interested In:

Automating the Linear Scheduling Method

Trimble TILOS is the Globe’s leading linear scheduling software.

Preferred by international leaders in infrastructure planning and construction, Trimble TILOS provides reliable & complete linear project schedules. By automating complex calculations required to optimize the linear project plan, TILOS quickly pays for itself.

Learn more about Trimble TILOS Linear Scheduling Software

Compare: TILOS Linear Software VS. Other Linear Planning Software.

Learn More About The Globe’s Premier Linear Scheduling Software